Prior to 10.1 version, this wait event was part of Buffer Busy Wait, however, after 10.1 this wait event was separated from buffer busy wait and is now visible in AWR reports. This wait event is reported if multiple sessions are waiting for the same data block to be read from the disk into the buffer cache. This could be alarming if this wait event is reported as one of the top wait events in the AWR reports. There could be different causes of this wait event to be at the top. In this article I will discuss how we can troubleshoot this wait event.
Slow IO or IO Latency of storage/disks
This wait event might be
reported if storage/disks are slow. If system is very busy and several sessions
are trying to read a block that is not in the buffer cache, this wait event
would occur, and if disk IO is slow, the wait time would certainly increase. To
check if IO is slow or not, you may follow this document in order to check in AWR report if disks IO rates are
acceptable for your database server. This document explains how to check IO latency at the Linux OS level.
If you find any evidence of IO slowness, fix the IO issue and this would help
eliminating this wait event from the list of top wait event.
Excessive physical reads and db file scattered read
Since this wait event is
related to physical reads, excessive physical reads may also cause this wait
event to appear among the top wait events. For application to work best, this
is a common advice to have physical reads as low as possible as compared to
logical reads (reading data from buffer cache), especially if it is an OLTP environment.
Always make sure that db file scattered reads is not among the top
events. If it is, it means that there are full table scans going on, thus
causing extra data to be read from the disks. Proper indexing reduces db file
scattered read wait event, hence reducing the physical reads.
Undersized SGA and physical reads
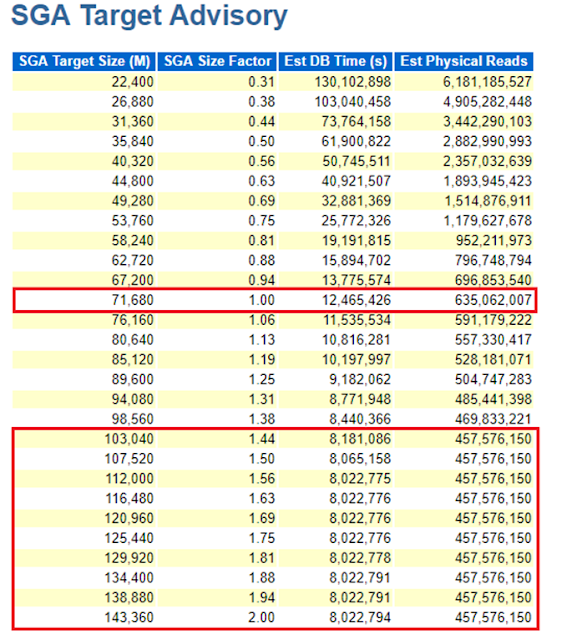
Undersized SGA would mean that buffer cache size is smaller and that would increase physical reads in the database. SGA Target Advisory section of the AWR report can be views for advice about increasing the SGA, to reduce physical reads. Following image shows a system with SGA_TARGET and SGA_MAX_SIZE set to 70G. SGA target advisory shows that if size of SGA is increase, it is expected to decrease physical reads significantly.
Stale or missing Statistics
You must also check if
there are objects in the database with missing or stale statistics. Although
Oracle’s auto stats job that runs during daily and weekly maintenance window is
supposed to gather statistics on the objects with stale or missing statistics,
but still there is possibility that there are objects with missing statistics.
For example, if a database has several tables that are very huge, the stats
gathering of these tables may not complete during the maintenance window and
therefore statistics would remain stale. These missing or stale statistics may
cause optimizer to generate unoptimized SQL plans and this could cause increase
in read my other session wait events. Following is how we can find out
tables with missing statistics.
|
select
owner,table_name from dba_tab_statistics where (stale_stats='YES' or
last_analyzed is NULL) and owner <> 'SYS'; |
Following query can be
used to check indexes with missing or stale statistics.
|
select
owner,index_name from dba_ind_statistics where (stale_stats='YES' or
last_analyzed is NULL) and owner <> 'SYS'; |
Gather table statistics
Following is the method
you can use to gather statistics on the tables.
|
SQL>
exec dbms_stats.gather_table_stats(ownname=>SALMAN,tabname=>'CREDIT_CARDS',cascade=>true,degree=>14) |


No comments:
Post a Comment