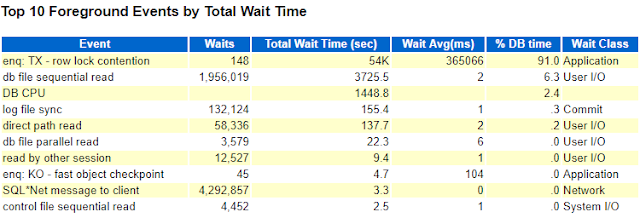
This wait event appears if continuous row locking and session blocking is happening in the in the database. If your end user complains about the application hang or slowness, excessive row locking could be one of the reason of it. Sometime an ad-hoc process executes for purging of data or bulk update of data that would cause huge locking whereby application users may face application slowness or hang. To identify the problem, you can generate AWR report to find out what is going on and find out what is causing locking. Following is an image of AWR report that shows row locking (eventually causing the sessions blocking) is responsible for more than 90% of database time.
Further if I check SQL statistics in this AWR report, I can see an update statement that was being executed several thousand times with each execution lasting for around 4.53 seconds.
Active Session History from
DBA_HIST_ACTIVE_SESS_HISTORY
Active session history
view can also be queried to further find out sessions details about the
blocking session. Query similar to the following can be used to find out this.
|
SQL> select
sample_time,module,program,event,machine,sql_id,event,session_id,session_Serial#,blocking_session,blocking_session_serial#,time_waited,wait_time,P1TEXT,p1,
p2text,p2,p3text, p3 ,CURRENT_FILE#, CURRENT_BLOCK#, current_obj#,
current_file#, current_block#, current_row# from dba_hist_active_sess_history |
Output is be as follows.


No comments:
Post a Comment