This a second article regarding IO latency issues investigation using AWR. First article can be found here. In this article I will further explain about checking IO latencies at the OS level in Linux
Log file sync
We had a production
server running on Virtual Machine (vmware), and after a downtime, we started
receiving complains about slow database. AWR report showed that “log fie sync”
wait event that comes under COMMIT wait class was at the top, and database was
spending more than 30% of its time on log
file sync wait. Log file sync wait even can be observed in a very busy OLTP
database, but it should not consume this much time as we were seeing, and
should be found at the bottom of the list of top wait events.

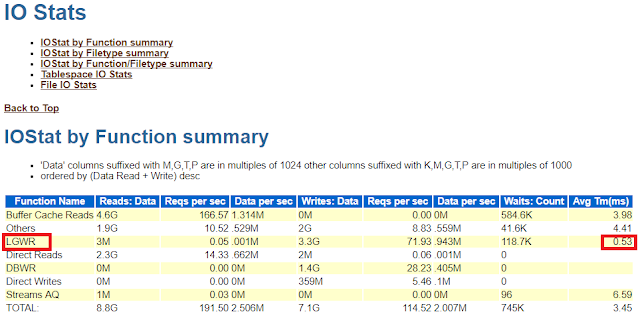
We generate another AWR report based on the “good” times and compared the IO Stats part of the AWR report with the current AWR report. Bellow you can see how much time LGWR was taking during good time and bad time.
Good time AWR
Bad Time AWR
It was quite clear that
system was suffering with huge IO latencies. To further investigate, we also
compared the “Wait Event Histogram” part of the AWR reports. This part contains
a long list of historgrams but I am showing you only some of them which related
to database IO
Good Time AWR
Bad Time AWR
In bad time AWR report
you can see the bigger numbers keep increase as you start reading from left to
write. Bigger numbers in the right side columns means that more number of IOs
were performed with more IO wait time (See columns headings to understand how
much IO wait for how many total IOs). For example, in bad time report if you
see log file sync wait time, 93% or IOs had a wait time between 32 milliseconds
and 1 second as compare to good time when same log file sync was taking 35.4%
of total IOs under 1 millisecond, and 38.4% IOs took less than 2 milliseconds
to complete. Same comparison can be done for other IO wait events like db file
scattered read, db file sequential read etc.
File System IO Stats Part of AWR Report
Looking into this part
of AWR report also shows the latency in occurring during IO. As you can see in
bellow image, average read time (ms) is quite high. Although this value should
be seen relative to the IO performance of your storage, for us, value above
30ms seemed quite high because during normal performance, we did not see IO
time exceeding 30 ms.
Conclusion
It was clear the there was something wrong with
the IOs. Later we realized that this VM server was moved from one data store to
a different data store where virtual disks (where database was stored) were on
the local disks, unlike SAN disks in original data store. After moving VM to
the original data store with the disks on the SAN, problem was resolved
automatically and IO latency was gone.
You may also find this article relevant and interesting to check disks io stats at OS level in Linux environments.
You may also find this article relevant and interesting to check disks io stats at OS level in Linux environments.


very good article. it really helped
ReplyDelete